Quick Assessment for Salvage Sales
Objective of a Quick Assessment
The first step in any salvage sale proposal should be to conduct the analysis described in this "Quick Assessment" prior to deciding how much of the area, if any, to salvage. This analysis will allow you to determine if the high density dead wood habitat in your project area is a unique contribution to landscape level biodiversity, or if this habitat is also provided in other areas of the landscape. This is the type of “pre-assessment” you should have available if you are meeting with a Rapid Assessment Team (RAT).
To keep the analysis "quick" the assessment relies on the Region-wide Distribution Analysis with only minor modifications for local conditions. For post-fire salvage, assessing only snag densities would be appropriate. For other disturbance types, assessment of down wood may also be appropriate.
A webinar on how to conduct a DecAID distribution analysis using the Regional assessment is available:
Introduction
When considering salvage opportunities after disturbance events, land managers should conduct a quick assessment of the affected landscape to determine whether or not snag pulses created are within the natural or reference range for snag distributions. If it is determined that high snag density areas are below the natural or reference levels, it may be preferable to forgo salvage harvest and retain the snag patches as wildlife habitat. Of course, land managers must weigh a variety of reasons for removal of dead trees (e.g., safety issues may trump the need to retain such patches for wildlife).
A vegetation distribution analysis allows you to compare current conditions to natural or reference conditions as represented by the Inventory Distribution Histograms in DecAID [Chart 1: Level 5], (e.g. PPDF_S.inv-22). This analysis can be conducted for snags and down wood. If the decision is made to move forward with planning a salvage sale, the process outlined in Distribution Analysis for Salvage Sales should be followed. This document outlines a less rigorous, pre-assessment methodology.
Step 1 - Delineate Analysis Area based on Disturbance Size and Severity
Project areas are usually delineated to encompass the area containing stands to be treated. These areas are usually too small to adequately analyze the impacts of the project on dead wood levels across the landscape. Thus the analysis area for assessing dead wood will be larger than the project area.
Snag and down wood levels in the analysis area can be compared against the information from inventory data contained in DecAID only if the area is large enough to allow such a comparison. The analysis area needs to be large enough to represent the variation in snag habitat and distribution from which the inventory data were collected. If this is not possible, a comparison between the project area and the inventory data is not appropriate.
The assumption of this methodology for calculating the size of the analysis area is that it needs to be large enough to reflect the size and intensity of the disturbance you are assessing so that current conditions in your analysis area represent the variety of habitat conditions in the area in which the inventory data were collected. Larger fires and insect outbreaks can skew the current conditions, even at the scale of a 10th field HUC, to the point that this assumption is no longer valid. At a watershed scale it may appear that there is an excess of dead wood because many disturbances are as large, or larger, than the watershed scale. But, it is likely still be a rare occurrence at the regional or sub-regional scale, scale at which the vegetation data were collected.
When looking at the vegetation inventory data from DecAID, we can assume that snag densities above the 80% tolerance level are likely created by stand-replacing disturbances. While not all plots in DecAID with snag densities >80% tolerance level are a result of recent stand-replacing disturbances, it can be assumed that stand-replacing disturbance creates snag densities that are >80% tolerance level from unharvested plots. Thus, a "rule of thumb" is analysis areas that have stand-replacing disturbance events composing about 20% of the area are assumed to represent the variation in snag habitat and distribution from which the vegetation inventory data were collected. However, remember the minimum size for each WHT is 12,800 acres. An analysis area of this size allows a comparison between current conditions and the vegetation inventory distribution histograms.
Step 1A: Determine the area with high-density snags from stand-replacing disturbance
Determine the number of acres in the disturbance area (e.g., fire perimeter) that currently have high snag densities (above the 80% tolerance level) from the current disturbance you are assessing. The simplest method to determine this number is to tally the number of untreated acres of high-severity disturbance in the project area by Wildlife Habitat Type. It is reasonable to assume these areas provide snag densities > 80 % tolerance level from DecAID inventory data.
For post-fire salvage assessments, the most expedient way to determine the area of high-severity disturbance is to use BAER or RAVG maps from the current fire. See the Wildfire Maps information in the Links to Useful Information section for information on these products. Most fires burn with mixed severity. These maps will identify areas the portion of the fire burned with high severity. When using BAER maps it is recommended that areas identified as High and Moderate Severity be considered "stand-replacing". With RAVG maps it is recommended that areas identified as >75% mortality (Class 4 from the 4-class RAVG map) be considered "stand-replacing".
Step 1B: Determine size of analysis area needed for assessing high-density snags
The acres of stand-replacing disturbance in the disturbance area from the current disturbance are used to calculate the appropriate size of the analysis area using a simple ratio:
(Acres current stand-replacing disturbance) / (Total acres w/in boundary of analysis area) = (20% DecAID landscape w/ high snag density) / 100
OR
(Total acres in analysis area) = (Acres current stand-replacing disturbance) / 0.20
This calculation needs to be completed for each Wildlife Habitat Type that is being considered for treatment. The analysis area needs to be large enough to encompass, at a minimum, the calculated number of acres in each Wildlife Habitat Type so that the DecAID histograms can be appropriately used to compare the contribution of snags within the project area to the larger landscape.
Example:
In this example, the project area contains habitat in the Eastside Mixed Conifer, East Cascades/Blue Mountains (EMC_ECB) and Ponderosa Pine/Douglas-fir (PPDF) Wildlife Habitat Types. The analysis area would have to encompass an area that would cover the greatest amount of acres required for each habitat type as shown in Table 1. In this case, the analysis area would need to contain at least 79,000 acres of the EMC_ECB habitat type, and 12,800 acres of the PPDF habitat type. In this case, 3,740 acres of PPDF is below the 12,800 acres needed to use vegetation data; use the 12,800 as the minimum.
Table 1. Determination of acres needed for Analysis Area large enough to appropriately compare DecAID inventory distribution data from unharvested plots to current snag levels.
| Habitat Type | Acres high fire severity in disturbance area | Acres required in habitat type within analysis |
|---|---|---|
| EMC_ECB | 15,800 | 15,800 /.20 = 79,000 |
| PPDF | 748 | 748 / .20 = 3,740 |
| total acres | 16,548 | 82,740 |
Step 1C: Delineate Analysis Area
Start out by delineating a contiguous area which encompasses the amount of area identified in Step 1 for the habitat type that encompasses the largest amount of acreage (in this case, EMC_ECB). Make the area logical in terms of watershed or administrative boundaries. One approach is to start with the 10th-field HUC watershed(s) that the disturbance occurred in. Add 10th-field watersheds or 12th-field sub-watersheds along the perimeter until the area requirement is met. Once this area is delineated, make sure it also encompasses the necessary acreage for the other habitat types in the project area. If the analysis area does not encompass enough acres of these remaining habitat types, continue to expand it, as above, until it does.
Step 2 - Distribution Analysis
The quickest, most expedient way to complete the assessment of dead wood after a disturbance is to use the Region-wide Distribution Analysis that is used for green sales, but update the assessment for the current disturbance by following the steps below. When looking at the Inventory Distribution Histograms it can be assumed that snag densities on the far right of the graphs are likely created by stand-replacing disturbances. The right side of the graphs also represents the area in higher tolerance levels for both vegetation and wildlife.
Step 2A: Determine Wildlife Habitat Type(s) in the Analysis Area
Links to descriptions and maps of the inventory plots are provided on the DecAID query page [Level 2] to assist the user in determination of the Wildlife Habitat Type(s) for an analysis area. There may be situations where the habitat type(s) in an analysis area are difficult to determine. In such cases, or wherever there is uncertainty about the Wildlife Habitat Type, you should consult the summary narratives in DecAID under Habitat Type Descriptions section. More detailed descriptions are provided by clicking on the link next to the drop down list for Wildlife Habitat Type on the DecAID Query Page. Then click on the heading for the 3rd column, WHR Wildlife Habitat, to get detailed descriptions.
Step 2b: Determine Historical Structural Condition(s) Within Each Wildlife Habitat Type in the Analysis Area
The minimum analysis area for applying the inventory data from DecAID to each Vegetation Condition for salvage sales may be large. Remember, Vegetation Conditions in DecAID are a combination of Wildlife Habitat Type and Structural Conditions Class. There are likely multiple Structural Conditions Classes in each Wildlife Habitat Type occurring in the analysis area. To avoid needing an analysis area large enough to encompass enough acres of each Vegetation Condition, a weighted average across Structural Condition Classes can be calculated for each Wildlife Habitat Type to reduce the size of the analysis area. The weighted average is calculated in the HRV tabs of the Summary spreadsheets in the Region-wide Distribution Analysis.
Consult with a silviculturist, reference available Watershed Analysis, etc. to estimate what percent of the landscape was within each structural stage for each Wildlife Habitat Type historically. To do this, one must become familiar with how the structural stages are used and described in DecAID. Structural Condition Classes are described in the Summary Narratives [Level 3] of DecAID under the Structural Condition Description section. A link is also provided next to the Structural Condition drop down list on the DecAID Query Page [Level 2]. The link will take you to a "Structural Condition Class" table with basic descriptions to assist the user in determination of the Structural Condition Class(es) present within each Wildlife Habitat Type.
Step 2C: Adjust “Current Condition” Distribution Histograms for Other Disturbances
For each Wildlife Habitat Type, determine the number of acres in the analysis area in each snag density and/or down wood percent cover class. Use the Region-wide Distribution Analysis to develop a preliminary distribution histogram.
The GNN data used in the Regional-wide Distribution Analysis is from 2012. The data have been updated for large fires (>1,000 acres) through 2014 using RAVG maps (http://www.fs.fed.us/postfirevegcondition/index.shtml). See the Metadata Spreadsheet (DecAID_Metadata.xlsx) for a list of fires used in the update. If other disturbances have occurred in the analysis area since 2012, adjust the current conditions on the distribution histograms. For a quick assessment, a cursory look will suffice. See Quick Assessment Example for a example approach.
Step 2D: Build Updated “Current Condition” Distribution Histograms for Each Wildlife Habitat Type and Compare to Vegetation Inventory Histograms
Distribution histograms are automatically created in the DecAID Distribution Analysis spreadsheets in the Region-wide Distribution Analysis. Histograms should to be created for each WHT in the Analysis Area, and for each dead wood type and size class (e.g., snags >25 cm and >50 cm; down wood >12.5 cm and >50 cm) as appropriate.
By entering the updated percent of the analysis area in the different snag density classes from Step 2C in the appropriate cells on row 55 of the DecAID Distribution Analysis spreadsheet, a distribution histogram is created for your analysis.
Interpretation of Assessment
Interpretations below are based on wildlife habitat and structural diversity provided by pulses of dead wood created by stand-replacing disturbances. This information is just one of the considerations that must be considered when deciding if a salvage sale should be pursued.
Figure 1. An example of a comparison of "reference" or "natural" conditions to updated current conditions using the Region-wide Distribution Analysis for snags >20" dbh.
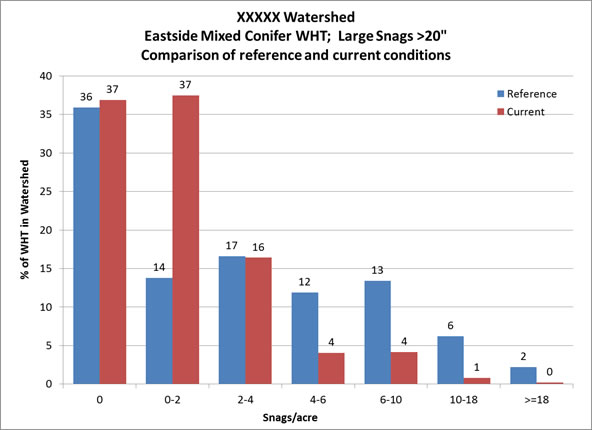
Scenario A - The analysis suggests that high density snag pulses are below natural or reference condition. In this example (Figure 1) the percent of the analysis area with elevated dead wood is less than what would be suggested by DecAID distribution histograms from unharvested plots. Land managers may want to forgo salvage in order to maintain snag habitats.
Figure 2. An example of a comparison of "reference" or "natural" conditions to updated current conditions using the Region-wide Distribution Analysis for snags >10" dbh.
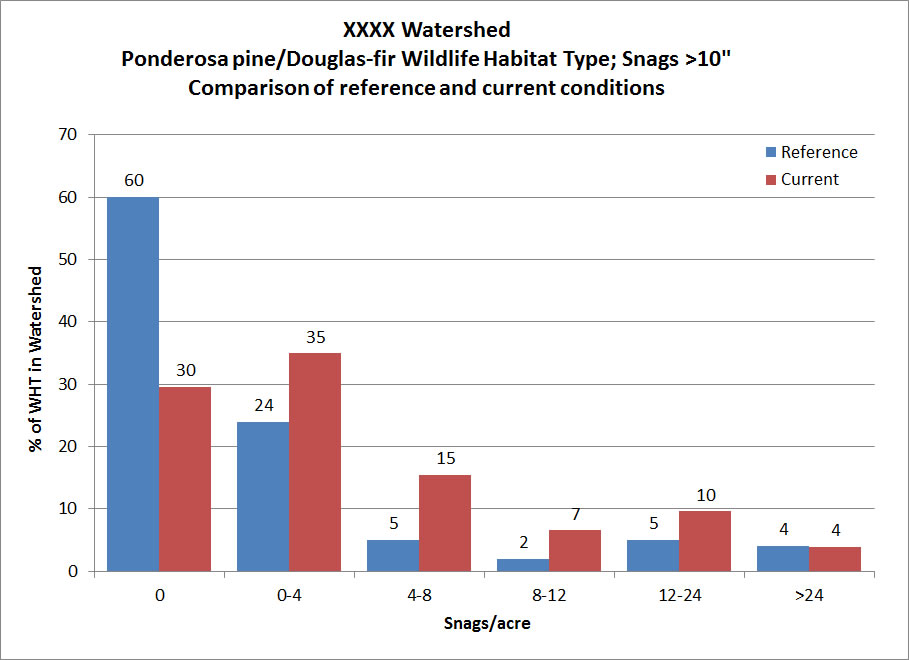
Scenario B - The analysis suggests that high density snag pulses are in excess of natural or reference conditions: In this example (Figure 2) the percent of the analysis area with elevated dead wood is greater than what would be suggested by DecAID distribution histograms from unharvested plots. Land managers may want to consider salvage opportunities to remove deadwood.
Figure 3. An example of a comparison of "reference" or "natural" conditions to updated current conditions using the Region-wide Distribution Analysis for snags >10" dbh.
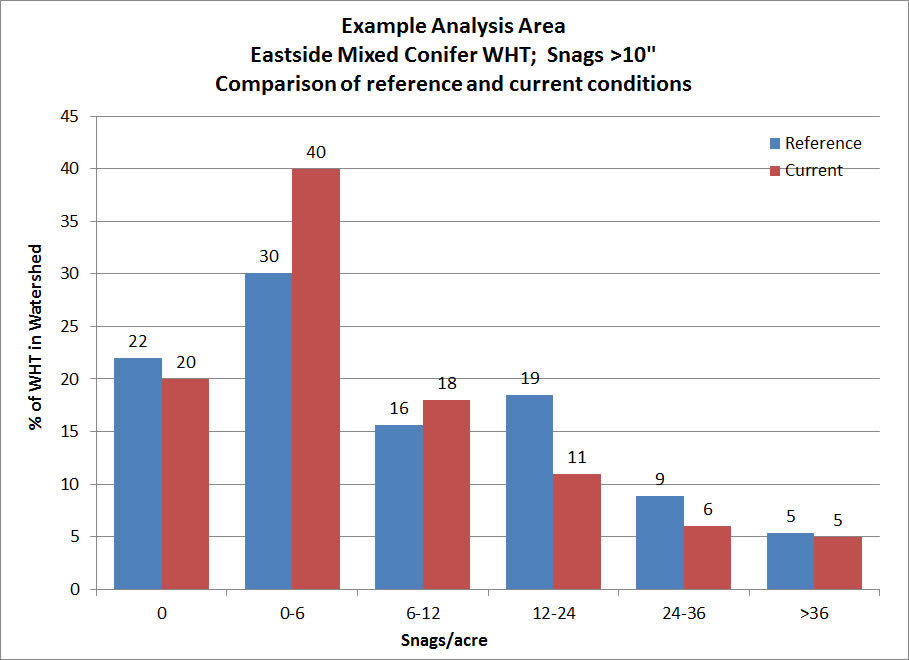
Scenario C - The analysis suggests that high density snag pulses are in similar to natural or reference conditions: In this example (Figure 3) the percent of the analysis area with elevated dead wood is similar to what would be suggested by DecAID distribution histograms from unharvested plots. Land managers may decide to forgo or minimize salvage to maintain wildlife habitat.
Other Considerations for Salvage
Many snag associated species are Management Indicator Species (MIS) or Regional Forester Sensitive Species. Habitat for these species should be assessed at the Forest scale. To determine the importance of habitat created by the current stand-replacing event, it may be prudent to look at how the distribution of dead wood habitat across the Forest compares to reference conditions.
Areas providing high density snag habitat after a disturbance are ephemeral. Within 5 to 10 years those areas will be providing moderate levels of snags and down wood as snags killed by the disturbance fall. If the distribution analysis indicates that the area is deficit in moderate snag densities (as is the case in Figures 1 and 3), it may be important to maintain enough of the high density snag pulse to provide areas with moderate snag densities in the near future. Leaving stand-replacing disturbances unsalvaged may be the only feasible way to move the landscape towards reference conditions for moderate snag densities.
Remember to account for hazard and danger tree removal in the disturbance area. Areas treated during wildfire suppression and BAER activities may be substantial.
References
Mellen-McLean, Kim, Bruce G. Marcot, Janet L. Ohmann, Karen Waddell, Susan A. Livingston, Elizabeth A. Willhite, Bruce B. Hostetler, Catherine Ogden, and Tina Dreisbach. 2012. DecAID, the decayed wood advisor for managing snags, partially dead trees, and down wood for biodiversity in forests of Washington and Oregon. Version 2.20. USDA Forest Service, Pacific Northwest Region and Pacific Northwest Research Station; USDI Fish and Wildlife Service, Oregon State Office; Portland, Oregon. http://www.fs.fed.us/r6/nr/wildlife/decaid/