DecAID Implementation Guide
Comparison of Historical Range of Variability for Dead Wood:
DecAID vs. Other Published Estimates
Introduction
DecAID uses vegetation inventory data from unharvested stands to approximate "natural" or "historical" levels of dead wood. However, in forest on the eastside of the Cascades, even unharvested stands have been impacted by management in terms of fire exclusion. This leads to the following caveat in DecAID:
"On the eastside in particular, current levels of dead wood may be elevated above historical conditions due to fire suppression and increased mortality, and may be depleted below historical levels in local areas burned by intense fire or subjected to repeated salvage and firewood cutting." (Mellen-McLean et al. 2012).
There is debate among professionals on the impact this issue has on stands relative to "natural" conditions and whether or not these data should be used has reference conditions. Below is a summary of several sources of published information on historical conditions of dead wood compared to the unharvested inventory data in DecAID.
Methods
There are several reports specific to eastside habitats that give estimates of amounts of dead wood in "presettlement" or historic times. Each report has its own methods, assumptions and limitations in the estimations. Each report also uses a different definition or size class of dead wood. In order to compare the reports, information in Brown et al. (2003) is used to standardize reporting units in terms of tons/acre of dead wood. Values from Brown et al.'s Table 1 and Table 2 were used to convert snags/acre of different sizes to tons/acre; Brown et al.'s Figure 1b was used to convert down wood percent cover to tons/acre.
The information is divided into 2 habitat categories:
- Dry forests with a low-intensity fire regime which is compared to the Ponderosa Pine/Douglas-fir (PPDF) Wildlife Habitat Type from DecAID
- Dry to mesic forests with a mixed to high-severity fire regime which is compared to the Eastside Mixed Conifer Forest Wildlife Habitat from DecAID
None of these reports are specific to any Structural Condition Class. Thus, for DecAID data, a weighted average, using sample size, for the 30%, 50% and 80% tolerance levels were calculated across structural condition classes and sub-regions. Using sample size to calculate the weighted average is based on the assumption that the current distribution of area within a habitat type among structural conditions is the same as it was historically. The tolerance levels from both unharvested plots with measurable snags or down wood and all unharvested plots are displayed and compared. None of the other estimated ranges included zero, however many are stand level averages which include some plot-sized areas with no snags. By displaying and comparing both sets of data to other existing information on historical dead wood amounts, the user can see the differences in the 2 data sets.
Some of the biomass figures are for a range of snag sizes and others are specific to just one snag size (dbh). Thus, DecAID data are displayed as one snag size (20 inches dbh) and for a mix of snag sizes greater than 10 inches dbh. Down wood is reported for > 5 inches diameter with a mix of size classes used to calculate tons/acre. The size class tables in DecAID (e.g. EMC_ECB_S.inv-1) were used to guide the mix of dead wood sizes in the calculation of tons/acre.
The information from the various studies and DecAID are presented in both table form and graphs. However, read the accompanying discussion to understand limitations of comparison between specific pieces of information.
Dry Forests, Low-Severity Fire Regime (PPDF)
Snags
Youngblood et al. (2004) studied dead wood in 3 Research Natural Areas (RNAs): Metolius and Pringle Falls RNAs in Oregon, and Blacks Mountain in northern California. The researchers stated: “We assume that processes contributing to mortality of large and old ponderosa pine remain essentially unaffected by recent fire exclusion, and thus the current population of snags provides the best representation of conditions before 1900.” They found an average of 10.3 upper canopy snags/ha (4.2/acre) in the 2 Oregon RNAs, with an average dbh of 60.5 cm (24.2 in) dbh.
Harrod et al. (1998) estimated historical snags densities in ponderosa pine dominated, dry forests. They estimated that densities of snags > 15 cm (6 in) dbh ranged from 14.5 to 34.6 snags/ha (5.9-14.1/acre) in pre-European settlement landscapes. They derived their estimates by calculating growth in basal area from pre-1930 growth rates and growth and basal area was then evenly distributed across all snag size classes. Forest stand structure was held relatively constant (i.e. as a new live tree is recruited another one becomes a mortality). Published snag fall rates were used to calculate basal area of snags every 10 years. They assumed snag loss was constant over time.
Agee (2002) estimated snag densities for the Ponderosa Pine/Douglas-fir forest series by estimating number of trees in 0.1 ha (0.25 acre) clumps of 16 age classes and assuming that the oldest patch is killed by insects every 25 years. He assumed fire helped to decompose snag patches and that after 5 fires at 10-year intervals the snags would be completely consumed. His estimated historical snag density was 500 snags per 100 ha (5/ha or 2/acre). Agee (2002) compares his estimates to Harrod et al. (1998) but states a different assumption about dbh of snags; Agee (2002) assumes an average snag dbh of 75 cm (30 in) when calculating biomass, while Harrod et al. (1998) estimated densities for size classes as small as 15 cm (6 in) dbh.
Korol et al. (2002 and unpublished data) derived historical range of variability (HRV) for snag densities in dry forests with a low-intensity fire regime of 1.0 to 1.7 snags/ha > 51 cm dbh (0.4 to 0.7/acre > 20 in). HRV was determined by subtracting and adding 30% to the average of 1.5 snags/ha > 51 cm dbh (0.6/acre > 20 in). They derived their estimates through review of the literature and discussion with experts.
Data from DecAID are displayed in 2 size groups. The 20 inch dbh snags are most comparable to Korol et al. (2002) as both conversions to biomass assume all snags are 20 inches dbh. The class of snags > 10 inches dbh includes a mix of snag sizes as does Harrod et al. (1998), and Agee (2002), though Agee assumes an average snag size of 30 inches which is larger than indicated by DecAID or Harrod et al. (1998).
Tables 1a&b and Figures 1a&b show the relationship between data from unharvested inventory plots in DecAID to other information on historical snag levels. The data from Harrod et al. (1998) gives the highest estimates for historical snag levels; it is at the high end of the DecAID data from unharvested plots with measurable snags. Korol et al. (2002) estimates are considerably lower than all other estimates except for the DecAID data from all unharvested plots. Estimates by Agee (2002) are higher than the data from DecAID for all unharvested plots, but are similar to the average estimates from unharvested plots with measurable snags. Agee (2002) just reports the average and thus does not provide information on the variability of snag densities across the landscape. The DecAID data show a wide range of snag densities occurring on the landscape. Historically there was likely wide variability in the quantities of both snags and down wood, with many stands having little dead wood and other stands having excessive accumulations (Brown et al. 2003).
Table 1a. Comparison of information on snag biomass for dry forests, low-severity fire regime (PPDF) - all DecAID unharvested plots
| Study/Source | Snag Size (dbh) | Snags/acre | Tons/acre |
|---|---|---|---|
| Agee 2002 | 30 inches | 2.0 | 3.6 |
| Harrod et al. 1998 | Mixed >6" | 5.9-14.1 | 4.5-71 |
| DecAID (PPDF) | >10 inches2 | 0, 0.5, 4.33 | 0, 0.6, 4.9 4 |
| Korol et al. 2002 | 20 inches | 0.4-0.7 | 0.53-0.934 |
| Youngblood et al. 2004 | 24 inches | 4.3 | 8.64 |
| DecAID (PPDF) | >20 inches2 | 0, 0, 1.043 | 0, 0, 2.7 4 |
Table 1b. Comparison of information on snag biomass for dry forests, low-severity fire regime (PPDF) - DecAID unharvested vegetation plots with measurable snags
| Study/Source | Snag Size (dbh) | Snags/acre | Tons/acre |
|---|---|---|---|
| Agee 2002 | 30 inches | 2.0 | 3.6 |
| Harrod et al. 1998 | Mixed >6" | 5.9-14.1 | 4.5-71 |
| DecAID (PPDF) | >10 inches2 | 2.1, 3.6, 9.73 1.5, 2.6, 7.04 | 2.4, 4.2, 11.14 |
| Korol et al. 2002 | 20 inches | 0.4-0.7 | 0.53-0.934 |
| Youngblood et al. 2004 | 24 inches | 4.3 | 8.64 |
| DecAID (PPDF) | >20 inches2 | 1.3, 1.7, 4.03 | 3.5, 4.6, 10.6 4 |
1per Brown et al. 2003, page 7
2mix of snag sizes as per weighted of snag size class tables in DecAID and Harrod et al. 1998 Table 3 as follows: 14" (70%), 26 " (30%)
3snag densities are weighted average of 30%, 50%, 80% tolerance levels from unharvested inventory plots with measurable snags; weighted average from across the 3 structural condition classes
4per Brown et al. 2003, interpolated from Tables 1 and 2
Figure 1a. All unharvested plots.
Figure 1b. Unharvested plots with measurable snags (vertical lines = 50% tolerance level).
Down Wood
Agee (2002) estimated historical amount of down wood based on falling of snags using the snag estimates described above. He also assumed that down wood had a limited residence time in a stand because of closer proximity to frequent surface fires. He estimated an average of 5 mg/ha (2.2 tons/acre) occurred in these stands.
Brown et al. (2003) estimated HRV for downed woody fuel (CWD) using inference from existing inventory data and knowledge of fire history and fuel consumption. They also estimated optimal levels of CWD which balanced risk (excessive soil heating, fire hazards) against benefits (site productivity, wildlife habitat) of different amounts of CWD. For warm, dry Ponderosa Pine and Douglas-fir forests they report HRV levels of 5-10 tons/acre and optimal levels of 5 to 20 tons/acre.
Korol et al. (2002 and unpublished data) derived historic range of variability (HRV) for down wood numbers in dry forests with a low-intensity fire regime of 0.4 to 0.8/acre > 20 inches. HRV was determined by subtracting and adding 30% to the average of 0.6/acre > 20 inches. They derived their estimates through review of the literature and discussion with experts. They assumed frequent fire consumed down wood. Assuming each log represents a 20 inch dbh tree, Korol's estimates equate to 0.5 to 1.1 tons/acre. This is probably an overestimate because logs do not necessarily include the entire tree.
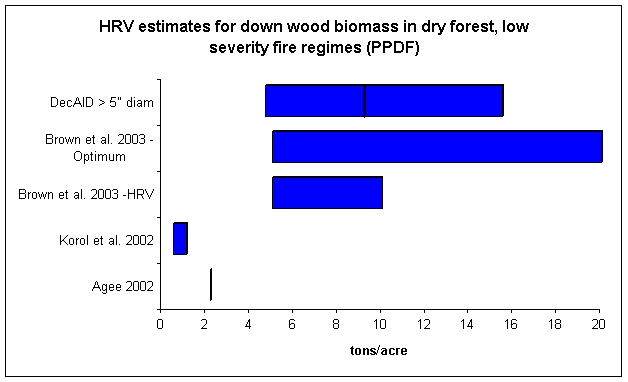
Tables 2a&b and Figures 2a&b show the relationship between data from unharvested inventory plots in DecAID to other information on historical down wood levels. Down wood levels from unharvested plots with measurable down wood in DecAID for Ponderosa Pine/Douglas-fir habitat types are considerably higher than levels reported by Agee (2002) or Korol et al. (2002) (Table 2b and Figure 2b). Agee (2002) and Korol et al. (2002) estimates are even at the low end of the DecAID data from all unharvested plots (Table 2a and Figure 2a). Frequent surface fires have not been occurring over the last several decades which means the down wood has not been consumed as in the Agee scenario. The DecAID data are within the optimum range determined by Brown et al. (2003) and overlap the HRV reported in the same publication, though the overlap is at the high end of estimates from all unharvested plots (Figure 2a), and at the low end for HRV compared to unharvestd plots with measurable down wood (Table 2b and Figure 2b).
Table 2a. Comparison of information on down wood biomass for dry forests, low-severity fire regime (PPDF) - all DecAID unharvested plots
| Study/Source | Diameter | Percent cover | Tons/acre |
|---|---|---|---|
| Agee 2002 | 30 inches | Not reported | 2.2 |
| Korol et al. 2002 | 20 inches | Not reported | 0.5-1.11 |
| Brown et al. 2003 - HRV2 | > 3 inches | Not reported | 5-10 |
| Brown et al. 2003 - Optimum | > 3 inches | Not reported | 5-20 |
| DecAID (PPDF) | >5 inches3 | 0, 0.2, 1.94 | 0, 0.9, 8.95 |
Table 2b. Comparison of information on down wood biomass for dry forests, low-severity fire regime (PPDF) - DecAID unharvested vegetation plots with measurable down wood
| Study/Source | Diameter | Percent cover | Tons/acre |
|---|---|---|---|
| Agee 2002 | 30 inches | Not reported | 2.2 |
| Korol et al. 2002 | 20 inches | Not reported | 0.5-1.11 |
| Brown et al. 2003 - HRV2 | > 3 inches | Not reported | 5-10 |
| Brown et al. 2003 - Optimum | > 3 inches | Not reported | 5-20 |
| DecAID (PPDF) | >5 inches3 | 1.0, 1.6, 3.34 | 4.7, 7.5, 15.55 |
1per Brown et al. 2003, interpolated from Tables 1 and 2
2per Brown et al. 2003, Figure 2
3mix of down wood sizes as per down wood size class tables in DecAID as follows: 4.5 (27%), 9" (41%) 18" (32%)
4down wood percent covers are weighted average of 30%, 50%, 80% tolerance levels from unharvested inventory plots with measurable down wood; weighted average from across the 3 structural condition classes
5per Brown et al. 2003, interpolated from values derived from Figure 1b
Figure 2a. All unharvested plots.
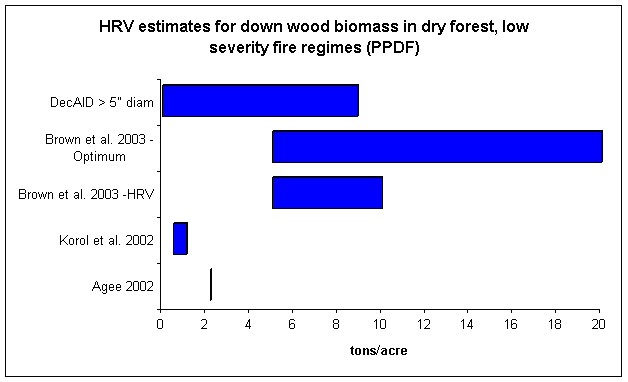
Figure 2b. Unharvested plots with measurable down wood (vertical lines = 50% tolerance level)
Dry to Moist Forests, Mixed-Severity Fire Regime (EMC)
Snags
Agee (2002) suggested that biomass of snags in mixed-severity fire regime areas dominated by Douglas-fir averaged 40 Mg/ha (17.8 tons/acre) of snags >23 cm (9 in) dbh across the variety of patch types and sizes. This estimate is based on the moist end of the EMC habitat type.
Korol et al. (2002 and unpublished data) derived their estimates of HRV through review of the literature and discussion with experts. HRV was determined by subtracting and adding 30% to the average. They report snag densities in three potential vegetation groups that fall within the EMC wildlife habitat type:
- Moist forests with a low-intensity fire regime: 2.9 to 5.4 snags/acre > 20 in. dbh with an average of 10.2 snags/acre.
- Dry forests with high-intensity fire regime: 1.8 to 3.3 snags/acre >20 in. dbh with an average of 2.6 snags/acre.
- Moist forests with high-intensity fire regime: 3.8 to 7 snags/acre >20 in. dbh with an average of 5.4 snags/acre.
Data from DecAID are displayed in 2 size groups. The 20 inch dbh snags are most comparable to Korol et al. (2002) as both conversions to biomass assume all snags are 20 inches dbh. The class of snags > 10 inches dbh includes a mix of snag sizes as does Agee (2002). See Tables 3a and 3b.
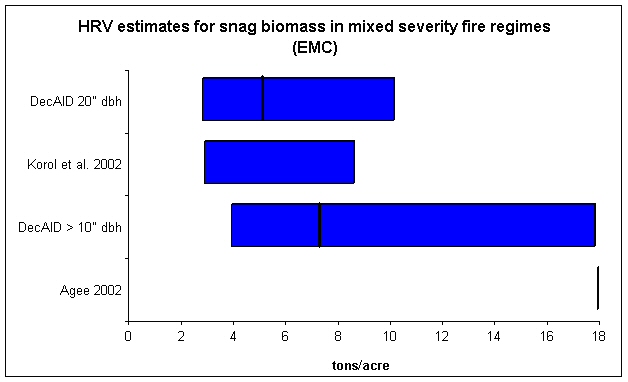
Tables 3a&b and Figures 3a&b show the relationship between data from unharvested inventory plots in DecAID to other information on historical snag levels. The data from Agee (2002), which are from the moist end of the EMC habitat type, are higher than inventory data from DecAID. Additionally, Agee (2002) just reports the average and thus does not provide information on the variability of snag densities across the landscape; the DecAID data show a range of snag densities occurring on the landscape. Historically there was likely wide variability in the quantities of both snags and down wood, with many stands having little dead wood and other stands having excessive accumulations (Brown et al. 2003). Estimates by Korol et al. (2002) are similar to the data from DecAID.
Table 3a. Comparison of information on snag biomass for dry to moist forests, mixed-severity fire regime (EMC) - all DecAID unharvested plotss
| Study/Source | Snag size (dbh) | Snags/acre | Tons/acre |
|---|---|---|---|
| Agee 2002 | 10 inches | Not reported | 17.8 |
| DecAID (EMC) | >10 inches1 | 2.6, 6.9, 20.32 | 1.8, 4.7, 13.83 |
| Korol et al. 2002 | 20 inches | 1.8-7.04 | 2.2-8.53 |
| DecAID (EMC) | 20 inches | 0, 1.5, 5.32 | 0, 1.8, 6.53 |
Table 3b. Comparison of information on snag biomass for dry to moist forests, mixed-severity fire regime (EMC) - DecAID unharvested vegetation plots with measurable snag
| Study/Source | Snag size (dbh) | Snags/acre | Tons/acre |
|---|---|---|---|
| Agee 2002 | 10 inches | Not reported | 17.8 |
| DecAID (EMC) | >10 inches1 | 5.5, 10.5, 25.92 | 3.8, 7.2, 17.73 |
| Korol et al. 2002 | 20 inches | 1.8-7.04 | 2.2-8.53 |
| DecAID (EMC) | 20 inches | 2.2, 3.8, 8.22 | 2.7, 4.6, 10.03 |
1mix of snag sizes as per weighted of snag size class tables in DecAID as follows: 10" (40%), 15" (35%), 20 in (25%)
2snag densities are weighted average of 30%, 50%, 80% tolerance levels from unharvested inventory plots with measurable snags; weighted average from across the 3 structural condition classes and 2 sub-regions
3per Brown et al. 2003, interpolated from Tables 1 and 2
4Low end of range from dry forests with high-intensity fire regime; high end of range from moist forests with high-intensity fire regime.
Figure 3a. All unharvested plots.
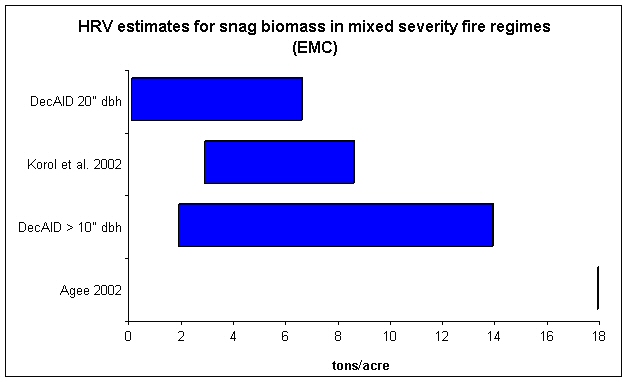
Figure 3b. Unharvested plots with measurable snags (vertical lines = 50% tolerance level)
Down Wood
Agee (2002) suggested that biomass of down wood in mixed-severity fire regime areas dominated by Douglas-fir averaged 55 Mg/ha (24.5 tons/acre) across the variety of patch types and sizes. This estimate is based on the moist end of the EMC habitat type.
Korol et al. (2002 and unpublished data) derived their estimates of HRV through review of the literature and discussion with experts. HRV was determined by subtracting and adding 30% to the average. They assumed frequent fire consumed down wood. Down wood densities are reported for three potential vegetation groups that fall within the EMC wildlife habitat type:
- Moist forests with a low-intensity fire regime: 0.7 to 1.3 logs/acre > 20 in. with an average of 1/acre.
- Dry forests with high-intensity fire regime: 2.1 to 3.9 logs/acre >20 in. with an average of 3.0/ acre.
- Moist forests with high-intensity fire regime: 5.2 to 9.6 logs/acre >20 in. with an average of 7.4/acre.
Assuming each log represents a 20 inch dbh tree, Korol's estimates range from 0.8 to 11.7 tons/acre for the EMC wildlife habitat type. This is probably an overestimate because logs do not necessarily include the entire tree.
Brown et al. (2003) estimated HRV for downed woody fuel (CWD) using inference from existing inventory data and knowledge of fire history and fuel consumption. They also estimated optimal levels of CWD which balanced risk (excessive soil heating, fire hazards) against benefits (site productivity, wildlife habitat) of different amounts of CWD. For types other than the warm, dry Ponderosa Pine and Douglas-fir forests they report HRV levels of 10 to 27 tons/acre and optimal levels of 10 to 30 tons/acre.
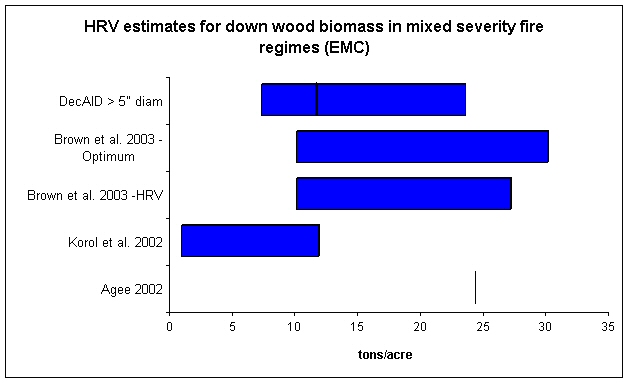
Tables 4a&b and Figures 4a&b show the relationship between data from unharvested inventory plots in DecAID to other information on historical down wood levels. Down wood levels from unharvested plots in DecAID for Eastside Mixed Conifer wildlife habitat types are lower than levels reported by Agee (2002) which are from the moist end of the EMC habitat type. The high end of the estimates by Korol et al. (2002) overlap the estimates from DecAID. The DecAID data are similar to, though slightly lower than, the both the HRV and optimum ranges determined by Brown et al. (2003).
Table 4a. Comparison of information on down wood biomass for dry to moist forests, mixed-severity fire regime (EMC) - all DecAID unharvested plots
| Study/Source | Diameter | Percent cover | Tons/acre |
|---|---|---|---|
| Agee 2002 | 10 inches | Not reported | 24.2 |
| Korol et al. 2002 | 20 inches | Not reported | 0.8-11.71,2 |
| Brown et al. 2003 - HRV3 | > 3 inches | Not reported | 10-27 |
| Brown et al. 2003 - Optimum | > 3 inches | Not reported | 10-30 |
| DecAID (EMC) | >5 inches4 | 0.5, 1.8, 4.95 | 2.0, 7.2, 19.56 |
Table 4b. Comparison of information on down wood biomass for dry to moist forests, mixed-severity fire regime (EMC) - DecAID unharvested vegetation plots with measurable down wood
| Study/Source | Diameter | Percent cover | Tons/acre |
|---|---|---|---|
| Agee 2002 | 10 inches | Not reported | 24.2 |
| Korol et al. 2002 | 20 inches | Not reported | 0.8-11.71,2 |
| Brown et al. 2003 - HRV3 | > 3 inchesNot reported 10-27 | Not reported | 10-27 |
| Brown et al. 2003 - Optimum | > 3 inches | Not reported | 10-30 |
| DecAID (EMC) | >5 inches4 | 1.8, 3.0, 5.95 | 7.2, 11.9, 23.46 |
1Low end of range from dry forests with high-intensity fire regime; high end of range from moist forests with high-intensity fire regime.
2per Brown et al. 2003, interpolated from Tables 1 and 2
3per Brown et al. 2003, Figure 2
4mix of down wood sizes as per down wood size class tables in DecAID as follows: 4.5 (30%), 9" (47%) 18" (23%)
5down wood percent covers are weighted average of 30%, 50%, 80% tolerance levels from unharvested inventory plots with measurable down wood; weighted average from across the 3 structural condition classes and 2 subregions
6per Brown et al. 2003, interpolated from values derived from Figure 1b
Figure 4a. All unharvested plots.
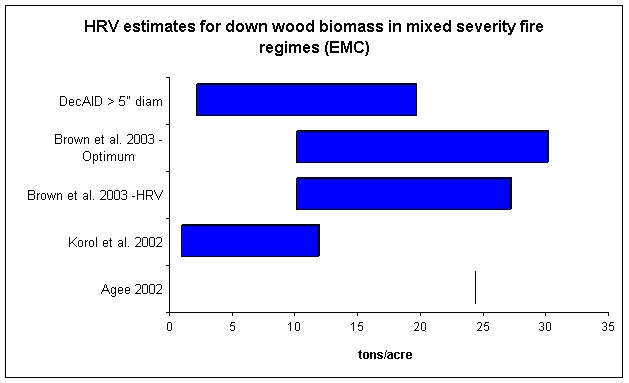
Figure 4b. Unharvested plots with measurable down wood (vertical lines = 50% tolerance level)
Literature Cited
Agee, James K. 2002. Fire as a coarse filter for snags and logs. In: Laudenslayer, William F., Jr.; Valentine, Brad; Weatherspoon, C. Philip; Lisle, Thomas E., technical coordinators. Proceedings of the symposium on the ecology and management of dead wood in western forests. 1999 November 2-4; Reno, NV. Gen. Tech. Rep. PSW-GTR-181. Albany, CA: Pacific Southwest Research Station, Forest Service, U.S. Department of Agriculture. http://www.fs.fed.us/psw/publications/documents/gtr-181/029_Agee.pdf
Brown, James K., Elizabeth D. Reinhardt, and Kylie A. Kramer. 2003. Coarse woody debris: Managing benefits and fire hazard in the recovering forest. Gen. Tech. Rep. RMRS_GTR-105. Ogden UT. USDA, Forest Service, Rocky Mountain Research Station. 16p. http://www.fs.fed.us/rm/pubs/rmrs_gtr105.pdf
Harrod, Richy J., William L. Gaines, William E. Hartl, and Ann Camp. 1998. Estimating historical snag densities in dry forests east of the Cascade Range. USDA Forest Service, Pacific Northwest Research Station, Gen. Tech. Rept. PNW-GTR-428, Portland, OR. 16 p. http://www.fs.fed.us/pnw/pubs/gtr_428.pdf
Korol, Jerome J., Miles A. Hemstrom, Wendel J. Hann, and Rebecca Gravenmier. 2002. Snags and down wood in the Interior Columbia Basin Ecosystem Management Project. In: Laudenslayer, William F., Jr.; Valentine, Brad; Weatherspoon, C. Philip; Lisle, Thomas E., technical coordinators. Proceedings of the symposium on the ecology and management of dead wood in western forests. 1999 November 2-4; Reno, NV. Gen. Tech. Rep. PSW-GTR-181. Albany, CA: Pacific Southwest Research Station, Forest Service, U.S. Department of Agriculture. http://www.fs.fed.us/psw/publications/documents/gtr-181/049_Korol.pdf
Mellen-McLean, Kim, Bruce G. Marcot, Janet L. Ohmann, Karen Waddell, Susan A. Livingston, Elizabeth A. Willhite, Bruce B. Hostetler, Catherine Ogden, and Tina Dreisbach. 2012. DecAID, the decayed wood advisor for managing snags, partially dead trees, and down wood for biodiversity in forests of Washington and Oregon. Version 2.20. USDA Forest Service, Pacific Northwest Region and Pacific Northwest Research Station; USDI Fish and Wildlife Service, Oregon State Office; Portland, Oregon. http://www.fs.fed.us/r6/nr/wildlife/decaid/
Youngblood, Andrew, Timothy Max, and Kent Coe. 2004. Stand structure in eastside old-growth ponderosa pine forests of Oregon and northern California. Forest Ecology and Management 199:191-217.
Author:
Kim Mellen-McLean
Reviewed by:
Richey Harrod
Miles Hemstrom
April 2006
Updated with Youngblood et al. 2004 data March 2011