Coarse Wood Dynamics Model (CWDM) Documentation (v2.0)
Grouping of species: Species were grouped based on similarity in decay characteristics. These characteristics included: susceptibility of heart wood to decay, ratio of sapwood to heart wood, bark thickness. "Focal" species was selected for each group. These species were selected primarily due to availability of empirical data. The focal species rates were then applied to other species in the group.
Snag fall and height loss: Rates were based on remeasurement data from snags on Forest Service lands. The data was collected through the Region 6 Continuous Vegetation Survey (CVS) program. During remeasurement, presence or absence of previously existing snags were noted and changes in height were recorded. Snags that disappeared during the remeasurement period where assumed to have fallen whole. Fall and height loss rates were averaged for size class (10-25, 25-75, >=75 cm dbh for most species; 10-20, 20-50, > 50 cm dbh for some species).
These base fall rates were adjusted in relation to site characteristics using a Bayesian Network (BN). Factors in the BN included: soil moisture, soil depth, slope position, [as determined by plant association in FVS] and presence of insect and/or disease. Conditional probabilities in the BN, reflecting the effect of each factor, were assigned by expert panel.
Decay rates: Information on decay rates was gleaned from studies of snag and/or log decay (Graham 1981, Graham and Cromack 1982, Harmon 2004, Harmon et al. 1996, Schowalter et al. 1998). If only log decay data were available, the decay rate for snag decay was calculated based on equations developed by the expert panel. Different equations were developed for areas east and west of the Cascades [westside 1.5 times log decay rate, eastside 0.5 time log decay rate].
These base decay rates were adjusted in relation to snag and site characteristics using a BN. Factors in the BN included: site temperature, site moisture, snag or log size. Conditional probabilities in the BN, reflecting the effect of each factor, were assigned by expert panel.
Expert Panel: An expert panel was used to fill in gaps in data for many tree species. The panel assisted in development of Bayesian Network (BNs) which combined data with expert knowledge. The panel was convened in Portland, OR on July 23-24, 2003. The panel included:
- Mark Harmon - Forest Ecologist, Oregon State University, Corvallis, OR
- Bruce Hostetler - Entomologist, USDA Forest Service, Westside Forest Insect & Disease Service Center, Sandy, OR
- Catherine Parks - Research Pathologist, USDA Forest Service, Pacific Northwest Research Station, LaGrande, OR
- Martin Raphael - Research Wildlife Ecologist, USDA Forest Service, Pacific Northwest Research Station, Olympia, WA
- Tom Spies - Research Forest Ecologist, USDA Forest Service, Pacific Northwest Research Station, Corvallis, OR
Other participants included:
- Rebecca Kennedy - Research Forest/Landscape Ecologist, USDA Forest Service, Pacific Northwest Research Station, Corvallis, OR
- Kim Mellen - Regional Wildlife Ecologist, USDA Forest Service, Pacific Northwest Region, Portland, OR
- Stephanie Rebain - Forester, USDA Forest Service FVS Program, Fort Collins, CO
Snag Fall BN - all provinces
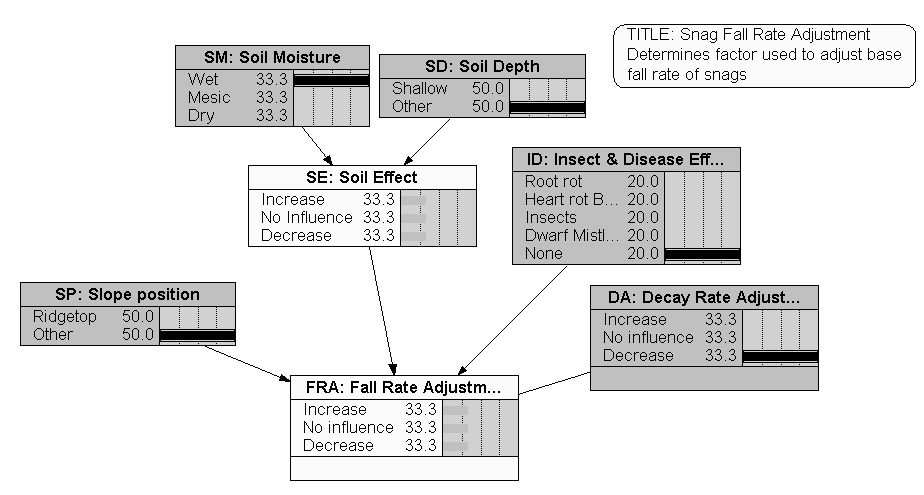
Soil Effect
- Effect on snag fall rate of soil moisture and soil depth.
- Shallow soils override soil moisture as the dominant factor - all shallow soils have a 100% chance of increase in fall rate.
- Wet soils decrease fall rate because roots are saturated and thus don't rot (windfall is not a problem with snags). Dry soils have some effect of increasing fall rates as roots rot faster.
- The basis from which to adjust fall rates is Mesic & Other (not shallow).
- Wet, mesic and dry sites will be determined based on ecoclass.
- To be defined based on local ecoclass or local knowledge
Soil Moisture
Soil Depth
Slope position
- Slope position impact on snag fall.
- Ridgetops override all other factors - snags on ridgetops always fall rapidly, regardless of other factors.
Insect and Disease Effects
- Effect of insects and diseases on fall rate of snags.
- Root rot as the highest influence on fall rates - always resulting in a 100% chance of increasing snag fall regardless of other factors.
- Heartrot has the next highest chance of increasing fall rates due to weakening of the bole.
- Dwarf mistletoe and insects have similar effects on chance of increasing fall rates.
- Dwarf mistletoe increases fall rates by creating a "sail" for wind to fall snags, similar to having some canopy left on a tree.
- The base for unadjusted fall rates is no insect and disease effects
Decay rate adjustment
- See decay rate adjustment factor in snag decay BBN.
- This node will receive values from the snag decay BBN for the applicable physiographic province.
- Effect of both broadscale and site specific temperature and moisture gradients, and snag size are incorporated in this node.
Fall Rate Adjustment
- Effect of slope position, soils, insects and diseases, and decay rate adjustment on snag fall rate.
- Possible values of -2 to 2
- Adjust fall rate as follows, with extrapolation between endpoints relative to BBN score.
- 2 - double fall rate (fall * 2)
- 0 - use base fall rate (fall * 1)
- -2 - 1/2 fall rate (fall * 0.5)
Snag Fall Lag BN - all provinces
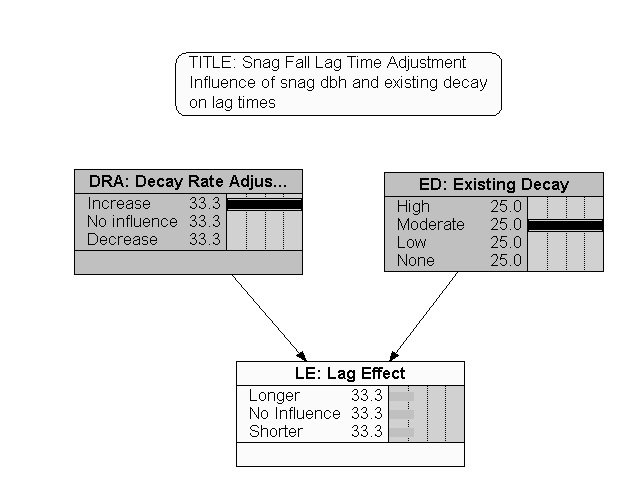
Decay Rate Adjustment
- Decay Rate Adjustment factor from province- specific Snag Decay BBN.
Existing Decay
- Amount of decay in tree before it dies - includes decay in roots and bole that influence how fast a snag falls
- No decay is the base for unadjusted lag times.
Lag Effect
- Effect of snag dbh and existing decay on lag time
- Possible values of -2 to 2
- Adjust lag time as follows, with extrapolation between endpoints relative to BBN score.
- 2 - double lag time
- 0 - no change in lag time
- -2 - lag time goes to zero
Snag Decay BN - separate variants for each physiographic province
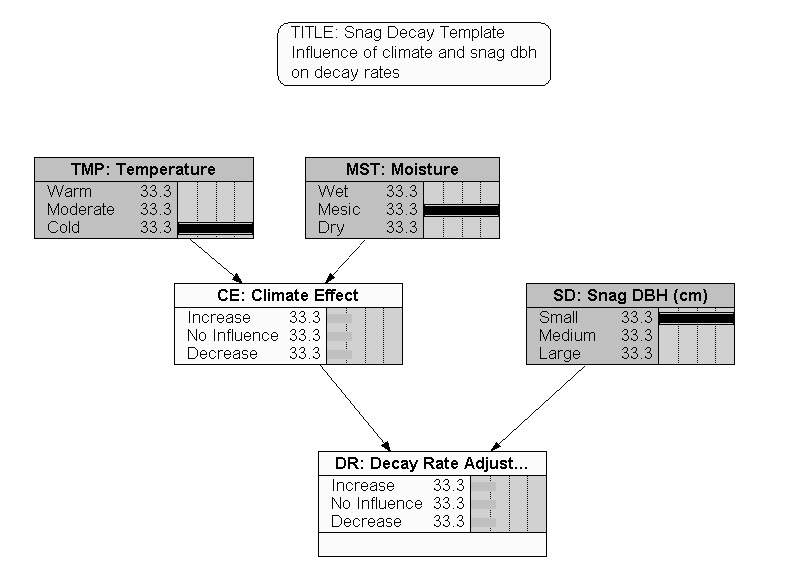
Climate Effect
- Influence temperature and moisture have on decay rates
- Climate effects vary by physiographic province
- In the coastal province moisture is plentiful, thus temperature is what drives the change in decay rates
- Moisture is slightly more limiting than it is in the Coast province but temperature is the primary driver of decay rates
- Moisture is the primary driver of decay rates on the eastside of the Cascades. Warmer temperatures will increase decay rates only when adequate moisture is available to allow for existence of decay organisms. The upper portion of snags on the east side may dry out and not decay as rapidly as the base, especially in thin-barked trees.
- Temperature of site - primarily a reflection of elevation
- May be determined by ecoclass of site
- Moderate is the base for unadjusted decay rates
- Moisture of site - primarily precipitation and/or humidity
- May be determined by ecoclass of site
- Mesic is the base for unadjusted decay rates
Temperature
Moisture
Snag DBH (cm)
- Size (diameter at breast height) of snag
- Size categories differ by species - see specieslist_ranked.xls for species specific diameter breaks.
- Assume smaller snags decay faster than larger snags Holds true for snags > 10 cm.
- Medium is the base for decay rates
Decay Rate Adjustment
- Determines Adjustment factor for decay rate based on snag dbh and climate effects.
- Possible values of -2 to 2
- Adjust decay rate as follows, with extrapolation between endpoints relative to BBN score.
- 2 - double decay rate (decay * 2)
- 0 - use base decay rate (decay * 1)
- -2 - 3/4 decay rate (decay * 0.75)
Snag Decay Lag BN - all provinces
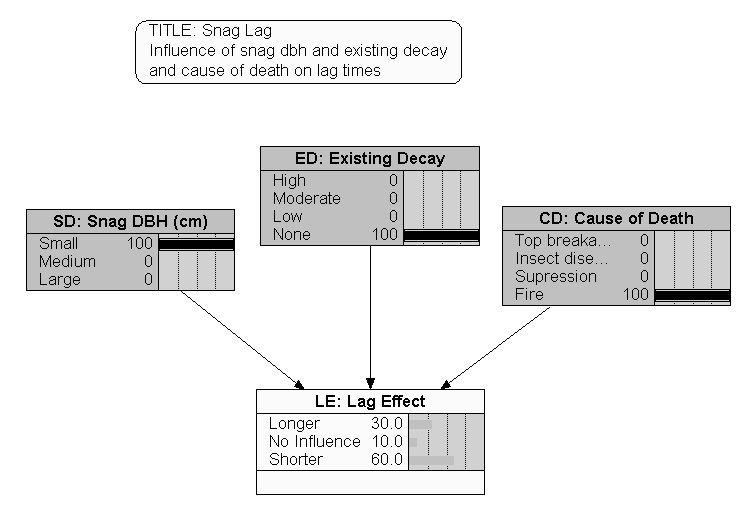
Snag DBH (cm)
- Size of snag at breast height
- Size categories differ by species - see specieslist_ranked.xls for species specific dbh breaks
- Assume small snags have a shorter lag time than larger snags.
- Medium is the base snag size for unadjusted lag times.
Existing Decay
- Amount of decay in tree before it dies
- Assume a high amount of decay reduces lag time
- No decay is the base condition for unadjusted lag times.
Cause of Death
- Top breakage reduces the lag time more than the other causes of death and will almost over-ride lack of existing decay.
- Insects increase lag time to a certain degree.
- Suppression mortality is the basis for unadjusted lag times.
- Fire mortality may increase lag time or may reduce lag time depending on circumstances - high level of uncertainty reflected in CPT scores.
Lag Effect
- Effect of snag dbh and existing decay on lag time
- Possible values of -2 to 2
- Adjust fall rate as follows, with extrapolation between endpoints relative to BBN score.
- 2 - double lag time
- 0 - use base lag time
- -2 - lag time goes to 0
Log Decay BN - separate variants for different physiographic provinces

Climate Effect
- Influence temperature and moisture have on decay rates
- Climate effects vary by physiographic province
- In the coastal province moisture is plentiful, thus temperature is what drives the change in decay rates
- Moisture is slightly more limiting than it is in the Coast province but temperature is the primary driver of decay rates. However, too much moisture can be a problem on wet sites. On dry sites in Coast province, moisture is still not limiting and will actually increase decay rates because logs will not be saturated as long.
- Moisture is the primary driver of decay rates on the eastside of the Cascades. Warmer temperatures will increase decay rates only when adequate moisture is available to allow for existence of decay organisms. Logs of thin-barked tree species will dry out faster than logs of thick-barked trees species.
- Moderate temperatures and mesic sites are the base for unadjusted decay rates.
- Temperature of site - primarily a reflection of elevation
- Moisture of site - primarily precipitation and/or humidity
Temperature
Moisture
Log Diameter (cm)
- Size (diameter) of log at large end.
- Size categories differ by species - see specieslist_ranked.xls for species specific diameter breaks.
- Assume smaller logs decay faster than larger logs. Holds true for logs > 10 cm.
- Medium is the base for unadjusted decay rates.
Decay Rate Adjustment
- Determines Adjustment factor for decay rate based on log diameter and climate effects.
- Possible values of -2 to 2 - Adjust decay rate as follows, with extrapolation between endpoints relative to BBN score.
- 2 - double decay rate (decay * 2)
- 0 - use base decay rate (decay * 1)
- -2 - 1/2 decay rate (decay * 0.5)
Log Decay Lag BN - all provinces
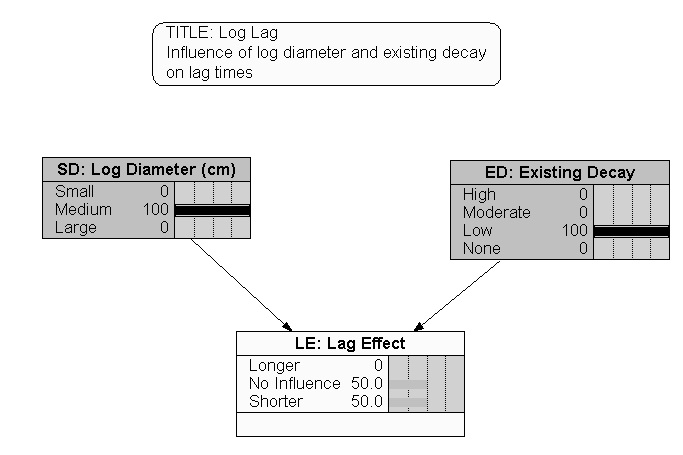
Log Diameter
- Size (diameter) of log at large end.
- Size categories differ by species - see specieslist_ranked.xls for species specific diameter breaks.
- Medium is the base size for unadjusted lag times.
- Assume smaller logs have shorter lag times than larger logs -Holds true for logs > 10 cm
Existing Decay
- Amount of decay in tree before it dies
- Assume a high amount of decay reduces lag time.
- No decay is the base for unadjusted lag times.
Lag Effect
- Effect of log large end diameter and existing decay on lag time.
- Possible values of -2 to 2 - Adjust fall rate as follows, with extrapolation between endpoints relative to BBN score.
- 2 - double lag time
- 0 - use base lag time
- -2 - lag time goes to 0
Literature Cited
Graham, R.L.L. 1982. Biomass dynamics of dead Douglas‑fir and western hemlock boles in Mid‑elevation forests of the Cascade Range. Ph.D. Thesis, Oregon State Univ., Corvallis, OR. 152 pp.
Graham, R. L. and K. Cromack, Jr. 1982. Mass, nutrient content, and decay rate of dead boles in rain forests of Olympic National Park. Canadian Journal of Forest Research. 12:511-521.
Harmon, Mark E., Becky Fasth, Jay M. Sexton. 2004. Bole Decomposition Rates of Seventeen Tree Species in Western U.S.A. Draft Report. Dept. Forest Science, Oregon State Univ., Corvallis. 34 pp.
Harmon, Mark E., Jay Sexton, and Becky Fasth. 1996. Decomposition rates of red and white fir in the Klamath Ranger District, Winema National Forest, Oregon. Draft Report. Unpublished report.
Schowalter, T. D., Y. L. Zhang, T. E. Sabin. 1998. Decomposition and nutrient dynamics of oak Quercus spp. logs after five years of decomposition. Ecography 21(1):3–10.